Postscript plots bvasqc.ps generated by
bvas.
This is a multi-page file, one page for each frequency, which shows
the quality of the trace alignment for the velocity solution. All
the traces in the analysis interval are shifted into alignment at
the solution velocity. A reference trace is taken as the first trace
in the interval of analysis. A relative time shift is computed from
the angle between each trace and the reference trace. That is, if
the reference trace is U, and another trace is S, then the angle between
S and the reference trace, U, is given by
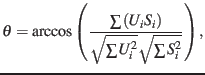 |
(6) |
and the relative time shift at that frequency is given by
 |
(7) |
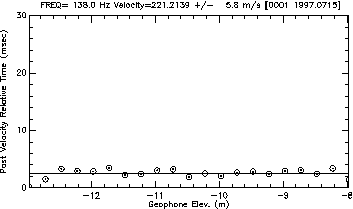
This relative time shift is plotted about a horizontal line, the
mean time shift for all the traces in the interval. The error bar
for the velocity analysis is derived from the scatter about this line.
A good quality solution is evident when the mean scatter is close
to zero, and the points are tightly clustered about the line. A large
mean, and large scatter indicate a poor quality solution. One should
also examine the nature of the scatter. If it is random, then the
interval is probably well chosen. However, if there appears to be
two or more linear trends in the points, then one may wish to re-evaluate
the choice of interval, as it may include more than one soil type.
Figure 20 shows a typical QC plot with  plotted against geophone elevation (analysis interval was -13 to -8
meters elevation).
plotted against geophone elevation (analysis interval was -13 to -8
meters elevation).
Figure 20:
Velocity analysis QC plot from file bvasqc.ps
|
 |
pm
2018-04-08