Next: Recording Aperture and the Up: Measurement of Inelastic Amplitude Previous: Postscript plot bamp.ps generated Contents Index
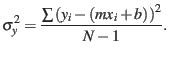
The decay error bars are based on the scatter of the points about
the least squares fit plotted in the bampqc.ps file. The variance
in decay is computed from the deviations about the line. In general,
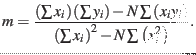
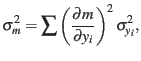
for any least squares solution of the form ![]() , the slope,
m, is given by,
, the slope,
m, is given by,
pm 2018-04-08
![$\displaystyle \sigma_{m}^{2}=\frac{N\sigma_{y}^{2}}{\left[N\sum\left(x_{i}^{2}\right)-\left(\sum x_{i}\right)^{2}\right]}.$](img62.png)