Running BVAX
This program measures surface wave dispersion. The bvax code has a
number of outputs:
- bvaxnnnn.lst Output listing,
nnnn.seg would be the input
file.
- bvax.ps Post script plot file of measured dispersion.
- bvaxqc.ps QC multipage plot, one page for each frequency.
- bvax.his Text file with 5 columns: [Frequency, Phase
Velocity, Velocity Uncertainty (1 Stdv), Semblance, Tbar (mean), Tvar
(variance)]
- semblance.dat Text file, 3 columns: [Frequency, Phase
Velocity, Semblance] used to generate Gnuplot files.
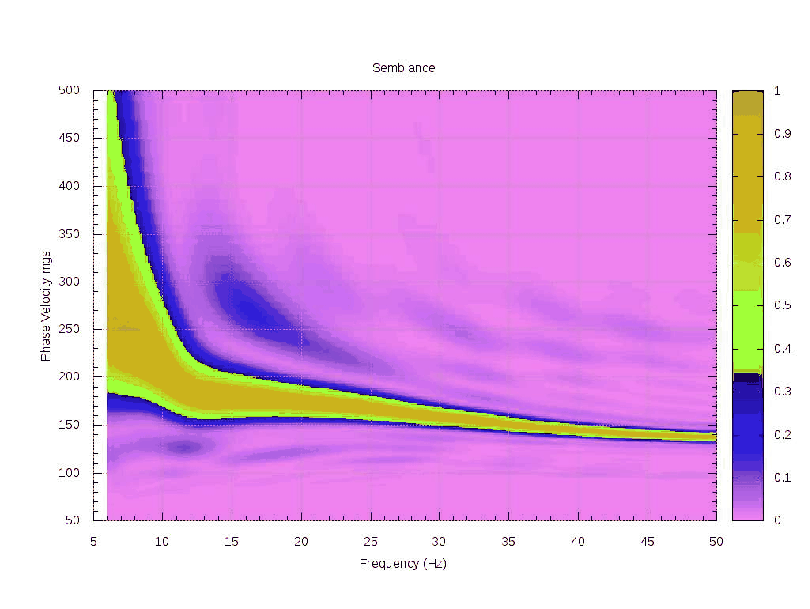
- CLRplot.gp This is a Gnuplot file that generates a color map of
dispersion semblance values.
- clrplot.png BVAX automatically generated image from CLRplot.gp
- CNTplot.gp This is a Gnuplot file that generates a contour plot
of dispersion semblance values.
- cntplot.png BVAX automatically generated image from CNTplot.gp
- MSHplot.gp This is a Gnuplot file that generates a mesh image of
semblance values.
- GRYplot.gp This is a Gnuplot file that generates a grey plot
image of semblance values.
Figure 41:
Color plot of semblance for example soil profile of Figure
42. The fundamental mode appears as red. A weaker higher mode is
also visible as a lighter shade of blue.
|
 |
pm
2018-04-08