Running traplt.m
- Start an Octave session
- In the Octave text window, enter the command:
traplt;
- In the octave text window, enter the name of the file to be plotted when
prompted.
- The program calls two functions, segyinfo.m and bsegin.m. The first
determines the number
of traces in the file, the sample interval, and other details. The second is
later used to read
a trace from the binary BSEGY file.
- An input GUI will pop up for entry of maximum time to plot and trace to
plot. The defaults
are the maximum recorded time and the last trace. Change these to what you
want.
- A plot of the signal should appear, along with a message GUI to pick a
time zero for the
phase plot. This will rotate the unwrapped phase.
- Click OK on the message GUI, then move the mouse into the waveform plot
and click a time zero
reference.
- Another GUI will pop up with the maximum frequency to plot in Hz. Modify
the entry as desired and click OK.
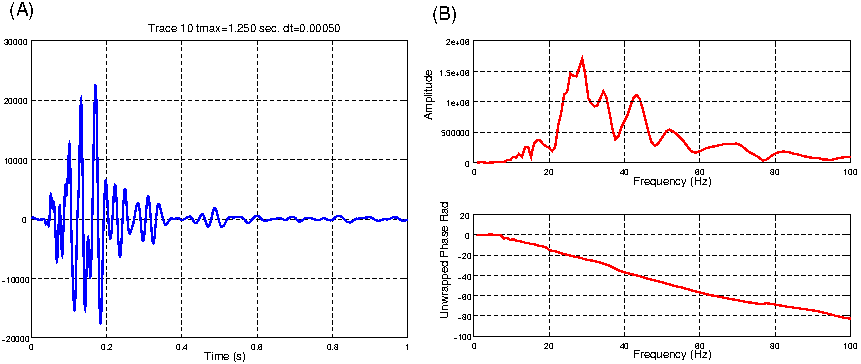
Plots can be saved using the menu bars. Figure
8 shows the data from trace 10 of a surface wave data set.
Figure 8:
Plots produced by traplt.m. (A). Time domain (B). Frequency
Domain
|
 |
pm
2018-04-08